

Learning curve example from WWII production in the US airframe industry
Log-log plot. The x-axis is cumulative plane number. The y-axis is the total on-site + off-site direct manhours per pound of airframe. This particular plot shows the production of B-29 airframes at the Boeing Wichita division. Page 75 from Source Book of World War II Basic Data - Airframe Industry. Volume 1. Direct Man-Hours - Progress Curves
- Date
- 1952-04-01
- Photographer / author
- US Army Air Forces, Air Force Materiel Command, Wright Field.
- Archive
- Wikimedia Commons
- Type
- image
- Original size
- 1,362 × 985 pixels
Public domainsafest
Reason: a US government work.
Read from: Commons licence category: PD US Government; no CC BY, CC BY-SA, GFDL or deletion tag on the file page.
Credit line
"Learning curve example from WWII production in the US airframe industry" (1952-04-01). US Army Air Forces, Air Force Materiel Command, Wright Field., via Wikimedia Commons. Public domain. https://commons.wikimedia.org/wiki/File:Learning_curve_example_from_WWII_production_in_the_US_airframe_industry.jpgNeed photos for a whole script? Add Find Any Photo to Claude and ask for this one by its id: 4874.
More like this

A record of Boeing-Witchita's 1,000th B-29 moving through the production lines.
U.S. National Archives
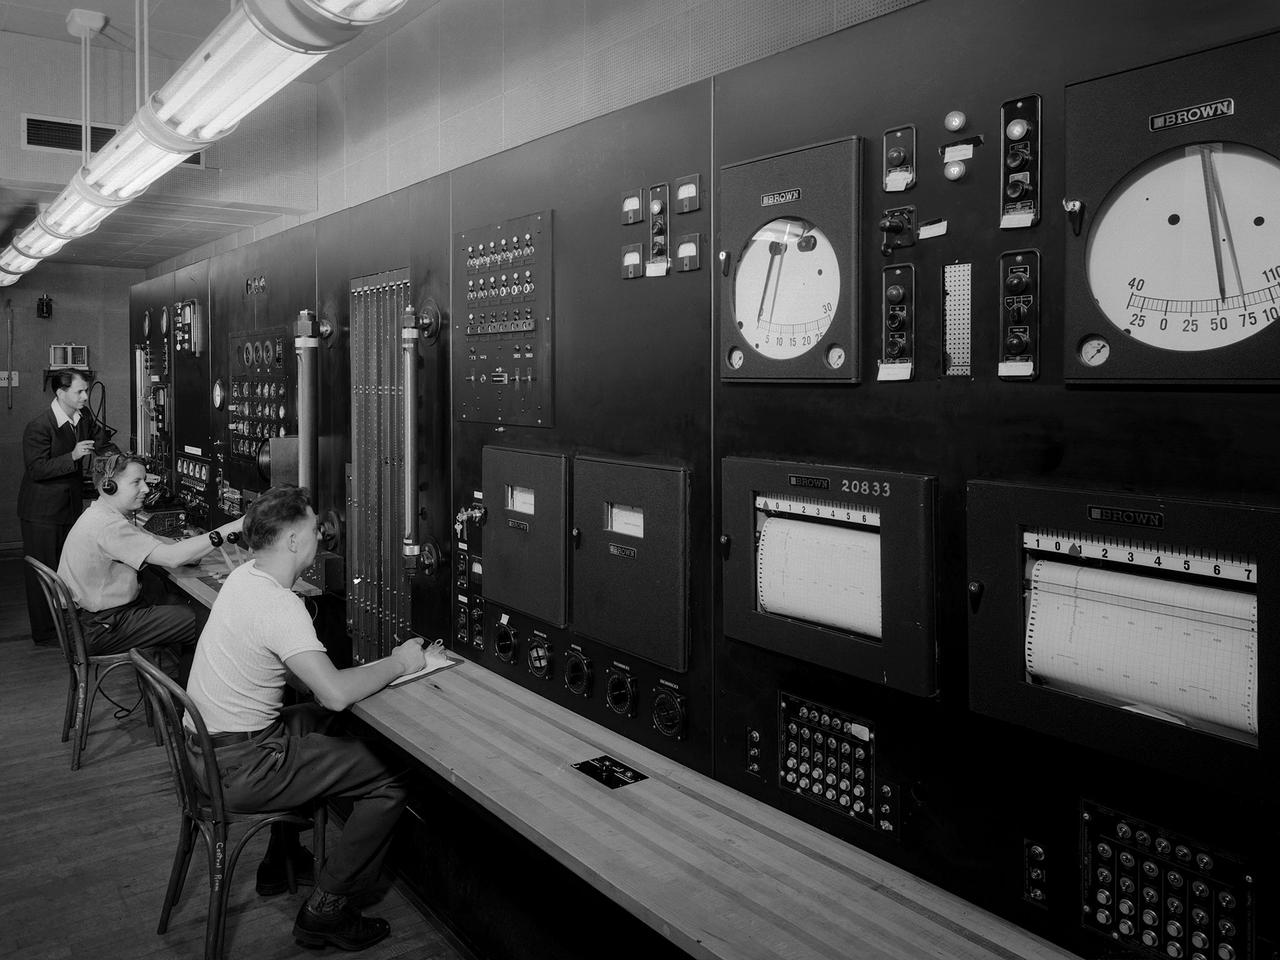
Altitude Wind Tunnel Control Room at the Aircraft Engine Research Laboratory
1944-07-23 · NASA Image and Video Library

B-24 bomber at Willow Run
1942–1943 · Library of Congress

Looking up one of the assembly lines at Ford's big Willow Run plant, where B-24E (Liberator) bombers are being made in great numbers.
c. 1943 · Library of Congress
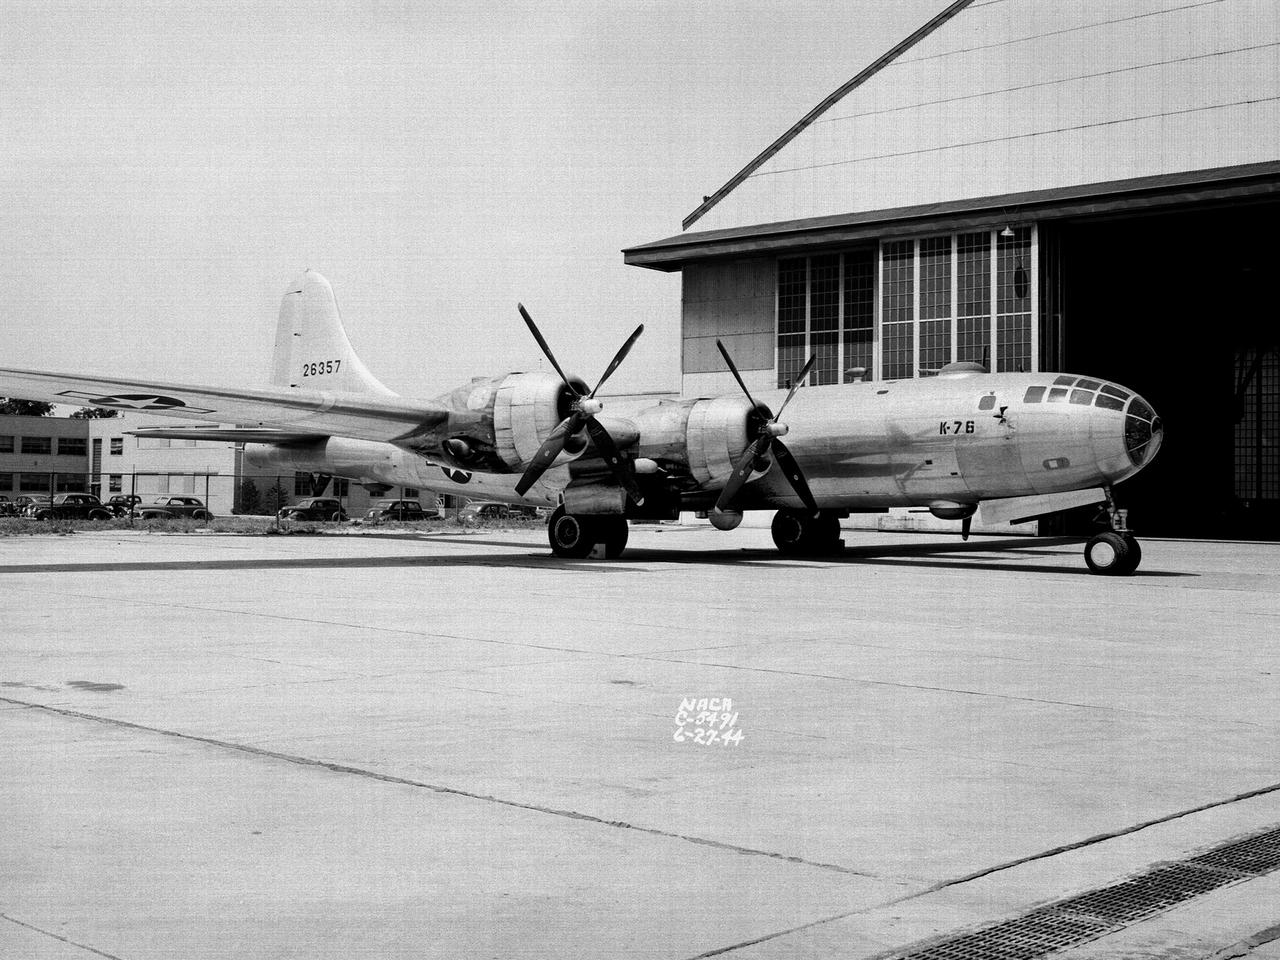
Boeing B–29 Superfortress at the Aircraft Engine Research Laboratory
1944-07-23 · NASA Image and Video Library

A completed B-17 F heavy bomber is checked by final inspectors at the Long Beach, Calif., plant of Douglas Aircraft Company before it moves to the flight line for rigid acceptance tests.
c. 1942 · U.S. National Archives

Production. Aircraft engines.
1942-07 · Library of Congress

Installing one of the four engines of a new B-24E (Liberator) bomber on one of the assembly lines of ford's big Willow Run plant.
c. 1943 · Library of Congress